How to Read a Sectional Chart—With Legend + Symbols Explained
BY Zacc Dukowitz
23 April 2026A sectional chart is a VFR (visual flight rules) aeronautical chart used by pilots for visual navigation.
Sectional charts show airspace, airports, terrain, obstacles, and other details that affect how and where aircraft can operate.
Sectional charts are not drone-specific, but they’re useful to drone pilots for assessing airspace, airports, terrain, and hazards.
If you’re a drone pilot studying for the FAA’s Part 107 test, you’ll need to understand how to read sectional charts. But reading a sectional chart isn’t about memorizing every symbol.
It’s about using the chart to answer things like:
- Can I fly here?
- What kind of airspace is this?
- Are there hazards or restrictions I need to account for?
In this guide, we’ll walk you through how to read sectional charts, including how to find locations, how to read airspace and airport symbols, and how to use the legend to make quick, accurate decisions.
Here’s everything we cover:
- Reading a Sectional Chart: Start With the Legend
- Location: How to Find Where You Are on a Sectional Chart
- Airports: Reading Airport Symbols on a Sectional Chart
- Airspace: Reading Airspace on a Sectional Chart
- Terrain: Reading Terrain, Obstacles, and Other Hazards
- How to Use a Sectional Chart on the Part 107 Test and in Real Flights
- 4 Sectional Chart Mistakes to Avoid
- How to Read a Sectional Chart FAQ
[Want the FAA’s official source for chart symbols and terms? Here’s the FAA’s Aeronautical Chart Users’ Guide.]
Reading a Sectional Chart: Start With the Legend
A sectional chart can look overwhelming at first.
There’s a lot happening on the page—airports, airspace boundaries, terrain, obstacles, and other markings layered together in one place.
That’s why the best place to start isn’t the map itself, but the legend.
The legend is the key that explains what the symbols, colors, and markings on a sectional chart mean, and how to interpret them correctly when it counts.

If you understand how to use the legend, you’ll be able to answer most chart questions without guessing.
If you want the official reference for chart symbols and terms, the FAA’s Aeronautical Chart Users’ Guide is the best source to keep handy.
Instead of trying to read the whole chart at once, it helps to break it into a few main types of information:
| What you’re looking at | What it helps you understand | Why it matters |
|---|---|---|
| Location | Where you are on the chart | You need to know the area before any symbol or boundary means anything useful |
| Airports | Where aircraft are operating nearby | Airports often shape the surrounding airspace and the level of caution required |
| Airspace | What rules or restrictions may apply | This is where you figure out whether authorization or extra review may be needed |
| Terrain and obstacles | What physical hazards may affect the flight | These markings help you spot towers, elevation changes, and other risks early |
Below, we’ll walk through each of these groups in a dedicated section so you can quickly get comfortable reading a sectional chart.
Once you know these groupings, sectional charts become much more approachable.
You’re no longer trying to decode everything at once—you’re just figuring out which type of information you’re looking at and using the legend to confirm what it means.
In practice, that’s how most chart-reading problems are solved.
You recognize the type of marking in front of you, check the legend when needed, and focus only on the part of the chart that answers the question you actually have.
Quick Examples: What the Legend Helps You Decode
Before getting into specific categories, it helps to see the kinds of questions the legend can help you answer.
Usually, you’re not decoding the whole chart at once. You’re using the legend to clarify one symbol or one small group of markings.
Here’s an overview:
| What you see on the chart | What the legend helps you confirm | Why it matters for a drone pilot |
|---|---|---|
| Blue or magenta airport symbol | What type of airport you’re looking at | Helps you judge how likely the airport is to affect your flight planning |
| Blue or magenta airspace boundary | What class of airspace the boundary points to | Tells you whether you may need authorization before flying |
| Tower or obstacle symbol | Whether the chart is flagging a vertical hazard | Helps you spot collision risks and line-of-sight issues early |
| Airport data block | What the listed frequencies or airport details refer to | Helps on Part 107 test questions and when assessing nearby airport activity |
Location: How to Find Where You Are on a Sectional Chart
Before a chart can help you answer anything useful, you need to know where you’re looking.
On the Part 107 test, that usually means finding a specific point on a printed chart. In the field, it means matching a job site or launch location to the right area on the map.
The key is to orient yourself first—then read the details.
Here’s a list of best practices for finding a location on a sectional chart:
1. Start With a Known Reference Point
In most cases, you won’t start with coordinates.
You’ll start with something familiar like:
- A town or city name
- A nearby airport
- A recognizable landmark (lake, highway, coastline)
Find that reference point first, then zoom your attention in from there.
2. Use Latitude and Longitude When Needed
Sectional charts include latitude and longitude markings along the edges. These let you pinpoint an exact location if a question gives you coordinates.
You don’t need to memorize how to navigate by coordinates, but you should recognize how they’re laid out:
- Latitude runs horizontally
- Longitude runs vertically
If a test question includes coordinates, use the grid lines to narrow down the location instead of guessing.
3. Work From General → Specific
Once you’ve found the right area, don’t try to read everything at once.
Use a simple progression:
- Find the general location
- Identify nearby airports or major features
- Look at the surrounding airspace
- Check for obstacles or terrain
This keeps you focused on what matters instead of getting lost in details.
Example—Finding a specific location on a sectional chart:
A Part 107 question gives you a set of coordinates and asks about airspace at that location.
Instead of scanning randomly, use the chart’s latitude and longitude lines to find the exact area first. Then identify the nearest airport or airspace boundary and use the legend to confirm what you’re seeing.
This keeps the process structured and prevents you from misreading the chart.
Airports: Reading Airport Symbols on a Sectional Chart
Airport symbols are one of the fastest ways to understand what’s happening around your launch area.
Most of the time, this means reading three things in order: the airport type, the runway depiction, and the data block when you need more detail.
These airport symbols can tell you what kind of airport you’re planning to fly near, how active it might be, and whether the surrounding airspace deserves a closer look.
Here’s a quick step-by-step for reading airport symbols on a sectional chart:
1. Start With the Airport Type
The first distinction to make is whether the airport is towered or non-towered.
On sectional charts, towered airports are typically shown in blue, while non-towered airports are typically shown in magenta.
That color difference matters because it gives you a useful first clue about the airport environment and the likelihood that controlled airspace may be involved.
That doesn’t mean every blue airport automatically creates the same issue, or that every magenta airport is simple. But it does give you a strong first signal about how much attention the area deserves.
2. Look at the Runway Depiction Next
After you identify the airport type, look at how the runway is shown.
- Larger, more clearly defined runway markings often point to a more developed airport with hard-surface runways.
- Simpler or less prominent runway depictions often suggest a smaller field with lower traffic volume or more limited infrastructure.
For a drone pilot, this is useful because it adds context.
A larger airport may deserve a more cautious review of the surrounding airspace and operating environment, while a smaller airfield may not need quite as much review.
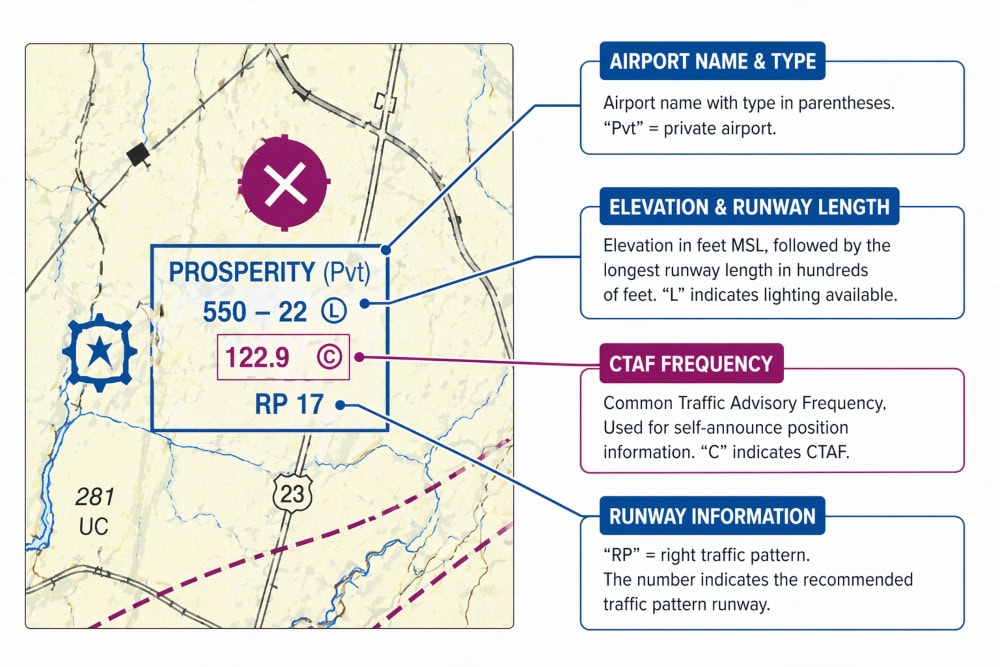
3. Notice the Data Block—But Don’t Overcomplicate It
Many airport symbols have a data block next to them. This usually includes compact information like elevation, frequencies (CTAF, UNICOM, etc.), runway length, or lighting details.
You don’t need to decode the entire block every time you see it.
But you should know that it exists, and you should be comfortable slowing down and reading it when a test question points you there or when the airport is relevant to your flight.
This is where people often make mistakes: they either ignore the data block completely or assume they have to interpret every line of it at once.
In practice, you usually only need one or two details from it.
| Airport cue | What it suggests | Why it matters |
|---|---|---|
| Blue airport symbol | Usually towered airport | Signals a busier airport environment and possible controlled airspace |
| Magenta airport symbol | Usually non-towered airport | Still important, but often a different operating environment |
| Prominent runway depiction | More developed airport | May indicate more activity and a more significant nearby airspace issue |
| Airport data block | Extra airport details | Useful for test questions and for understanding the field more clearly |
Example—When you actually need to use the data block:
You find an airport symbol near your planned launch site.
Start by checking whether it is blue or magenta. Then look at the runway depiction and the surrounding airspace before deciding whether the area is likely to require extra caution or authorization.
If a question or flight decision depends on the airport itself, then look at the data block for the specific detail you need.
Airspace: Reading Airspace on a Sectional Chart
Airspace is where sectional charts really matter for drone pilots.
Airspace determines things like:
- Where you can fly your drone
- When you need authorization
- What kind of restrictions might apply
The challenge is that airspace isn’t labeled in plain language—it’s shown through colors, boundaries, and symbols that you have to interpret correctly.
Once you know what to look for, you can quickly identify the type of airspace you’re dealing with and decide what to check next.
Airspace Symbols: Where You Can and Can’t Fly
On a sectional chart, airspace is indicated using two things:
- Color (blue, magenta, etc.)
- Line style (dashed or solid)
Here’s a cheat sheet connecting color and line style to airspace type:
| Chart cue | Usually indicates | Practical takeaway |
|---|---|---|
| Solid blue line | Class B airspace | Stop and verify the rules before assuming you can fly |
| Solid magenta line | Class C airspace | Expect controlled airspace and check authorization needs |
| Dashed blue line | Class D airspace | Often tied to an airport with a control tower |
| Dashed magenta line | Class E to the surface | Controlled airspace can begin at ground level |
| No clear line/boundary nearby | Possibly Class G at the surface | Still check for nearby airports and overlying airspace |
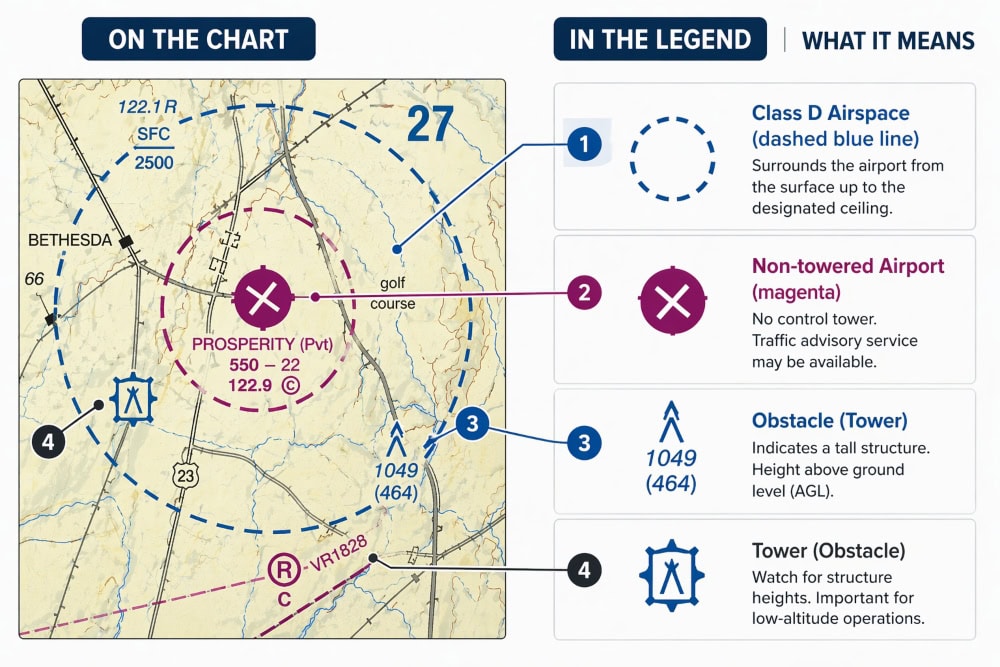
Here’s an example to show you how these types of airspace are actually depicted:

What These Airspace Markings Mean in Practice
Once you identify an airspace boundary on the chart, the next step is figuring out what kind of airspace you’re dealing with—and what that means for your flight.
Here’s a simple way to think about it:
| Airspace type | What it usually means | What to do next |
|---|---|---|
| Controlled airspace | More structured FAA oversight | Check whether authorization or other restrictions apply |
| Uncontrolled airspace | Usually simpler, but not automatically clear | Still check nearby airports, overlying airspace, and hazards |
| Special use airspace | Area that deserves extra attention | Do not assume it’s fine—slow down and verify what the marking means |
A few practical rules help here:
- If you see a controlled-airspace boundary near your launch area, assume you need a closer look before flying.
- If you see special use airspace, treat it as a cue to verify the area—not as something to ignore or guess about.
- If no obvious boundary is shown, that may point to Class G at the surface—but you still need to check the surrounding chart context.
The goal isn’t to memorize every airspace category in isolation.
It’s to recognize what kind of area you’re looking at and know what follow-up step that chart cue should trigger.
Terrain: Reading Terrain, Obstacles, and Other Hazards
Terrain and obstacle markings are easy to overlook on a sectional chart, especially when most of your attention is on airspace.
But for drone pilots, this part of the chart still matters.
It helps you spot physical hazards that can affect your flight, your line of sight, and your safety margin before you ever launch.
Here’s a simple way to think about these markings:
- Terrain tells you what the ground is doing
- Obstacles tell you what is sticking up from it
- Other hazard cues help you notice where an area may be less simple than it looks from the ground
In practice, most terrain-related checks come down to a few key things you should look for in sequence:
1. Look for Obvious Vertical Hazards First
For most drone pilots, the fastest thing to check is whether the chart is flagging something tall in the area.
That usually means towers, antennas, or other vertical obstacles that could affect your route, your altitude planning, or your ability to maintain line of sight. A place that looks open from the ground may not actually be simple once you notice what is rising above it.
If you’re flying near structures, power infrastructure, or uneven terrain, this is often the first hazard check worth making.
2. Use Terrain Cues to Understand the Area
The legend also explains how terrain is shown on the chart. Depending on the area, that may include contouring, shading, elevation information, or other markings that help you understand how flat—or not flat—the surrounding ground really is.
That matters because terrain changes the flight environment in ways that are easy to underestimate. A ridgeline, slope, or uneven area can affect your line of sight, your route planning, and how much margin for error you really have.
For a drone pilot, the practical question is not “How do I read every terrain marking?” It’s “Does this area look more complicated than I first thought?”
3. Treat MEFs as a Warning Flag, Not a Drone Rule
You may also see maximum elevation figures, or MEFs, on sectional charts. These are designed for manned aircraft, not drones, so they are not a direct operating limit for your mission.
But they are still useful because they tell you, at a glance, that significant terrain or obstacles exist in that area.
In other words, an MEF is less about telling you how high to fly a drone and more about telling you that the area deserves a closer look.
Example—When terrain and obstacles matter more than you expect:
A launch area may look clear on the ground, but the chart shows a nearby tower and rising terrain just beyond it.
That changes the picture quickly. Even if the airspace is straightforward, the physical environment may still require a more careful route, lower operating margin, or a different launch position.
In practice, this is where the sectional chart adds value: you’re catching potential issues before you arrive on site instead of reacting to them in the field.
How to Use a Sectional Chart on the Part 107 Test and in Real Flights
Once you understand how to read the main parts of a sectional chart—location, airports, airspace, and terrain—the next step is actually using that information.
Let’s look at using it on the Part 107 test and for real drone missions.
How to Read Sectional Charts for the Part 107 Test

On the Part 107 test, the FAA is usually interested in seeing if you can interpret one area, one symbol, or one relationship.
This is where the legend helps.
If a question points to an airport, an airspace boundary, or an obstacle symbol, the legend gives you a way to confirm what you are seeing instead of relying on memory alone.
The key is to start with the question, not the entire chart.
Figure out what the FAA is actually asking about, then use the chart and legend to decode only the symbol or marking that matters.
Doing this keeps you from wasting time on unrelated details and helps you avoid common traps, like confusing towered and non-towered airports or misreading a controlled-airspace boundary.
Do This for Chart Questions and Flight Checks
Use this sequence to work through sectional chart questions:
- Find the location first
- Identify the nearest airport or airspace cue
- Use the legend to confirm what the symbol means
- Check for obstacles, terrain, or other nearby hazards
- Decide what follow-up step is required
This approach keeps you from scanning randomly. Instead of trying to read the whole chart, you move from location to symbol to decision.
How to Use Sectional Charts in Real Drone Missions
Of course, the main value of learning how to read sectional charts is to use them for real drone missions.
In real flight planning, sectional charts give you a fast way to understand the environment around your launch point before you get into finer legal or operational checks.
For a drone pilot, that usually means checking three things first:
- Nearby airports
- Surrounding airspace
- Obvious hazards like towers or rising terrain
A quick look at the chart can tell you whether a location is likely to be simple or whether it deserves a closer review before you commit to flying there.
This is especially helpful when you’re evaluating a site you haven’t visited before.
A sectional chart can show you that a small airport is closer than you thought, that controlled airspace sits just over the area, or that obstacles nearby may affect your route, your line of sight, or your safety margin.
4 Sectional Chart Mistakes to Avoid
Sectional charts get easier once you stop trying to read everything at once.
Most mistakes come from approaching the chart the wrong way—not from the chart itself being impossibly complicated.
If you can avoid a few common habits, the whole process becomes much more manageable.
1. Trying to Decode the Entire Chart at Once
This is the most common mistake, and it’s usually what makes sectional charts feel overwhelming.
A better approach is to narrow the problem first. Find the location, identify the specific symbol or boundary that matters, and use the legend to confirm what you’re seeing. In most cases, you do not need to interpret the entire chart to answer the question in front of you.
2. Treating Every Airport or Airspace Cue the Same Way
Not every airport symbol means the same thing, and not every airspace marking carries the same level of concern.
A blue airport symbol, a dashed magenta boundary, and a tower symbol are each telling you something different. The key is not just noticing that a cue exists, but understanding what kind of cue it is and what follow-up step it should trigger.
3. Ignoring Terrain and Obstacle Information
A lot of readers focus so heavily on airspace that they overlook the physical environment.
That can lead to bad assumptions. A location may be simple from an airspace standpoint but still have towers, rising terrain, or other hazards that affect the flight. The chart helps you catch those problems early, which is one of the main reasons it’s useful in real planning.
4. Treating the Chart as the Final Answer
A sectional chart is an important planning tool, but it is not the only tool you should use.
It helps you understand the area and spot issues that deserve a closer look. What it does not do is replace current FAA resources, authorization checks, or other required preflight steps. The best use of the chart is to guide your next decision—not to assume you already have the whole answer.
If you keep these four mistakes in mind, sectional charts become a lot easier to work with.
You’re no longer trying to memorize everything or guess your way through it—you’re using the chart the way it was meant to be used.
How to Read a Sectional Chart FAQ
Here are answers to some of the most commonly asked questions about how to read a sectional chart.
Do drone pilots actually need to know how to read sectional charts?
Yes. If you are studying for the Part 107 test, chart-reading is part of the knowledge you are expected to understand. In real operations, sectional charts are also useful for early flight planning, especially near airports or controlled airspace.
What is the legend on a sectional chart?
The legend is the key that explains what chart symbols, colors, and markings mean. It helps you confirm what you are seeing instead of guessing.
Do sectional charts tell you whether you can legally fly?
Not by themselves. They help you understand the airspace and environment around a location, but they do not replace current FAA tools, authorization checks, or other required preflight steps.
What do blue and magenta mean on a sectional chart?
They often help distinguish different types of airports and controlled airspace boundaries. The exact meaning depends on the symbol or line style, which is why the legend matters.
Are sectional charts only useful for the Part 107 test?
No. They are especially important for test prep, but they also help drone pilots evaluate airspace structure, nearby airports, and hazards before a flight.
What is the fastest way to improve at chart-reading questions?
Start by learning the most common symbols and boundary cues, then practice using the legend as a lookup tool instead of trying to memorize everything at once.